Cover Gallery

Cover J. Phys. Chem. Lett. 14 (2023) 21,
Depiction of the exothermic peak feature characteristic for the cubic to hexagonal ice transition measured by calorimetry (enthalpy change given). Model depictions of the cubic and hexagonal structures emphasize their structural difference on the atomic level. In the background, a photograph of real hexagonal ice is shown.
 J. Phys. Chem. Lett.14 (2023) 21
,
J. Phys. Chem. Lett.14 (2023) 21
,  Cover
Cover
doi (Article):10.1021/acs.jpclett.2c02074
, Article

Supplementary Cover J. Phys. Chem. Lett. 34 (2022)
IR measurements show how the strength of the hydrogen bonds increases within the course of the transformation from high- to low-density amorphous ice, following the OD-stretch mode. Phase coexistence is observed at intermediate temperatures.
J. Phys. Chem. Lett. 34 (2022), Cover
doi (Article):10.1021/acs.jpclett.2c02074, Article
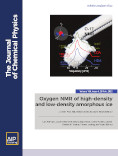
Cover J. Chem. Phys. 156 (2022) Issue 8:
The cover shows an indium container containing a high-pressure ice polymorph. As the container was heated, the polymorph underwent a phase transition resulting in the "popping" of the ice. In our work, different ice polymorphs were synthetized with O-17 water and were therefore measurable with NMR. The viewgraph shows some of those NMR spectra of different ice polymorphs at different temperatures.
J. Chem. Phys. 156(8) (2022), Cover
doi (Article):10.1063/5.0080333, Article

Cover J. Phys. Chem. A 125 (2019) Issue 4:
The cover shows an ice cube taken out of a liquid nitrogen dewar using tweezers for subsequent near-infrared (NIR) analysis. The viewgraph shows a spectrum that resembles the letters NIR. In our work, NIR spectra of high-pressure ice polymorphs II, IV, V, VI, IX, and XII were measured for the first time. Spectra were recorded in diffuse reflectance geometry at ambient pressure and liquid nitrogen temperature, avoiding undesired phase transitions. Each ice polymorph shows unique overtones and combination bands. Especially, the first overtone of the OH stretching vibration is a good marker band for distinguishing different ices. A clear blue-shift of the OH stretching band with increasing (topological) density is observed. This might be of importance for a remote detection of high-pressure ice phases in astrophysical environments.
J. Phys. Chem. A 125(4) (2021), Cover
doi (Article):10.1021/acs.jpca.0c09764, Article
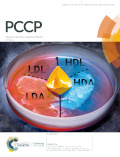
Front Cover Phys. Chem. Chem. Phys. 21 (2019) Issue 42:
The image shows two distinct liquids at supercooled conditions. A paper boat is sailing on the non-crystalline phase diagram, involving the two liquids (LDL and HDL), two amorphous solids (LDA and HDA) and the purported liquid-liquid critical point. In how far aqueous solutions help to learn more about the phase behavior and water's properties is discussed in our perspective.
doi (Front Cover): 10.1039/C9CP90264C, Front Cover
doi (Article):10.1039/C9CP02953B, Article

Cover J. Phys. Chem. A 123 (2019) Issue 38:
In the front of the cover is an artistic visualization of a 2-mode potential energy surface (PES), expanded in the H2O symmetric stretch and bending coordinates. Such a PES is the key to accurate computation of molecular vibrations, as used in the assignment of the matrix-isolated H2O infrared spectrum shown in the back.
J. Phys. Chem. A 123(38) (2019), Cover
doi (Article):10.1021/acs.jpca.9b07221, Article

Inside Front Cover Chem. Sci. 9 (2018) Issue 18:
The cover picture shows a model of ice VI on a bed of ice. The two interpenetrating oxygen networks are coloured in red and blue. The hydrogen atoms which we ordered to obtain ice β-XV are symbolized by light blue pearls.
doi (Inside Front Cover):10.1039/C8SC90095G, Inside Front Cover
doi (Article):10.1039/C8SC00135A, Article
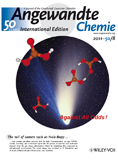
Back Cover Angew. Chem. Int. Ed. 50 (2011), Issue 8:
The tail of comets such as Hale-Bopp may contain gas-phase carbonic acid. In their Communication Grothe, Loerting, and co-workers report the IR spectra of carbonic acid molecules trapped from the gas phase, information critical in identifying this compound in astrophysical environments. The comet image was provided by E. Kolmhofer and H. Raab, Johannes-Kepler-Observatory, Linz (Austria).
doi (Back Cover):10.1002/anie.201008066, Back Cover
doi (Article):10.1002/anie.201004729, Article
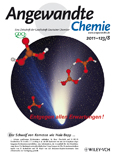
Rücktitelbild Angew. Chem. 123 (2011), Issue 8:
Der Schweif von Kometen wie Hale-Bopp könnte gasförmige Kohlensäure enthalten. In ihrer Zuschrift beschreiben H. Grothe, T. Loerting et al. die IR-Spektren von aus der Gasphase abgefangenen Kohlensäuremolekülen, eine Information, die wesentlich für die Identifizierung dieser Verbindung in astrophysikalischen Umgebungen ist. Die Kometenaufnahme wurde von E. Kolmhofer und H. Raab von der Johannes-Kepler-Sternwarte Linz (Österreich) zur Verfügung gestellt.
doi (Rücktitelbild):10.1002/ange.201008066, Rücktitelbild
doi (Article):10.1002/ange.201004729, Article
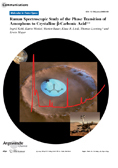
Frontispiece Angew. Chem. Int. Ed. 48 (2009), Issue 15:
What's the matter? The laboratory Raman spectra for carbonic acid (H2CO3), both for the β-polymorph and its amorphous state, are required to detect carbonic acid on the surface of the pole caps of Mars, when the Mars Microbeam Raman Spectrometer lands on the planet. The picture shows a martian crater with ice of unknown composition, possibly containing carbonic acid (image adapted from DLR, with permission from ESA, DLR, and FU Berlin – G. Neukum).
Frontispiece, Frontispiece
doi (Article):10.1002/anie.200805300, Article
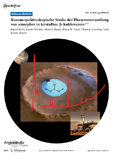
Frontispiz Angew. Chem. 121 (2009), Issue 15:
Hilfreiche Labordaten für die Detektion von Kohlensäure auf der Oberfläche der Mars-Polkappen, wenn 2009 das Mars-Microbeam-Raman-Spektrometer wie geplant auf dem Mars landet, bieten die hier vorgestellten Raman-Spektren von Kohlensäure (H2CO3), und zwar sowohl vom β-Polymorph als auch vom amorphen Zustand. Der Bildhintergrund zeigt einen Marskrater mit Eis unbekannter Zusammensetzung, in dem möglicherweise Kohlensäure existiert (Überarbeitung eines Bildes der deutschen Marskamera, mit Erlaubnis von ESA, DLR und FU Berlin – G. Neukum).
Frontispiz, Frontispiz
doi (Article):10.1002/ange.200805300, Article
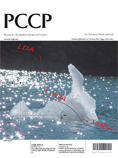
Front Cover Phys. Chem. Chem. Phys. 8 (2006), Issue 24:
A compression curve of amorphous ice at 125K on the background of a small iceberg photographed near Spitzbergen.
doi (Front Cover):10.1039/b607755m, Front Cover
doi (Article):10.1039/b603159e, Article
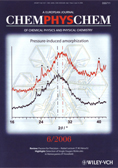
Front Cover ChemPhysChem 7 (2006), Issue 6:
The cover picture shows two powder X-ray diffractograms recorded from two different "ice" samples obtained by pressurizing cubic (red) and hexagonal (black) ice crystals at 80K. Sharp peaks marked with an asterisk are from traces of hexagonal ice.
doi (Front Cover):10.1002/cphc.200690018, Front Cover
doi (Article):10.1002/cphc.200600011, Article
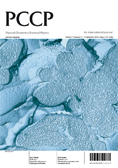
Front Cover Phys. Chem. Chem. Phys. 7 (2005), Issue 17 and Cover of the Year:
Ultrastructure of micrometre-sized water droplets hyperquenched to a glass, heated to 180K and visualized by electron microscopy.
doi (Front Cover):10.1039/b511102c, Front Cover
doi (Article):10.1039/b507651j,
Article
This page was last updated on February 18, 2021.  Imprint
